

“Those who cannot remember the past are condemned to repeat it!”
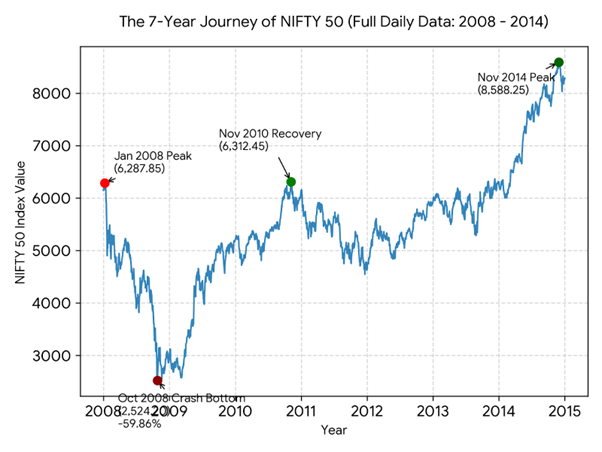
When we look at a stock market chart, it is easy to see only a sequence of numbers, dates, and trendlines. But underneath the data lies something far more volatile: a real-time map of human emotion. Between 2008 and 2015, Indian equity investors were subjected to one of the most intense psychological experiments in modern financial history. This seven-year lifecycle of the NIFTY 50 offers a vital masterclass in how market cycles interact with the human psyche—and why a trusted advisor is essential to surviving them.
Phase 1: Euphoria and The Blind Spot
- The Data Point: January 8, 2008 | NIFTY 50: 6,287 (All-Time High for the year)
- The Emotional State: Extreme Optimism, Greed, and Invincibility
- The Investor Mindset: Entering 2008, the Indian economy was firing on all cylinders. Real estate and stocks weren’t just growing; they were multiplying. Investors suddenly “discovered” an aggressive risk tolerance they never knew they had.
Wealth managers were bombarded with calls—not from clients managing risk, but from individuals demanding to know why they weren’t fully leveraged in aggressive infrastructure or thematic mid-cap funds. New market entrants congratulated themselves on their financial genius, while advisors struggled to take credit for returns that the market was handing out indiscriminately. Seduced by easy gains, a massive wave of retail capital crossed over into the leveraged world of Futures & Options (F&O) to multiply their paper profits.
Phase 2: The Initial Shock and Denial
- The Data Points:
- January 22, 2008 | NIFTY 50: 4,899.30 (-20.26% rapid correction)
- July 17, 2008 | NIFTY 50: 3,947.20 (-35.76% drawdown from peak)
- The Emotional State: Shock, Denial, and Nervous Reassurance
- The Investor Mindset: The year began with a brutal wake-up call as the NIFTY plunged over 20% in mere weeks. Initially, the consensus was comfortable: this was just a “healthy correction”.
But as the months bled out and the index drifted toward the 3,000 mark, a distinct behavioral shift occurred. Long-term investors simply froze. Traumatized by the sight of red on their screens, they stopped opening their statements and treated their advisors’ calls to continue investing with deep mistrust.
Traders in the F&O segment faced a harsher reality. Unable to emotionally swallow a loss, many ignored their stop-losses. Instead of cutting positions, they poured more margin capital into losing trades to stave off imminent liquidation—unwittingly multiplying their eventual losses.
Phase 3: Capitulation and Absolute Despair
- The Data Points:
- October 15, 2008 | NIFTY 50: 3,338.40 (Post-Lehman Brothers Collapse)
- March 2, 2009 | NIFTY 50: 2,674.60 (The Absolute Bottom: -56.47% Peak-to-Trough)
- The Emotional State: Panic, Terror, Hopelessness, and Betrayal
- The Investor Mindset: When Lehman Brothers collapsed in September 2008, the market’s orderly bleed turned into a chaotic bloodbath. By March 2009, the NIFTY had lost over half its value. Global financial headlines screamed of systemic collapse, and the psychological pain became visceral. Genuinely believing the entire financial system was going to zero, a massive wave of investors reached their breaking point.
This was the textbook Capitulation Phase. Overriding their advisors’ logic, broken investors logged into their accounts and sold everything at the absolute bottom, desperate to “save whatever little was left.” They walked away with an overwhelming sense of anger and betrayal. Crucially, however, a disciplined minority chose to separate their emotions from the noise, recognized the deep inherent value of a heavily discounted market, and quietly continued their systematic allocations.
Phase 4: Disbelief and The “Sucker’s Rally”
- The Data Points:
- June 4, 2009 | NIFTY 50: 4572.64
- January 12, 2010 | NIFTY 50: 5,210.40
- The Emotional State: Scepticism, Cynicism, and Regret
- The Investor Mindset: Almost overnight, the market engineered a violent, unexpected turnaround largely supported by the FII liquidity created by quantitative easing . By mid-2009, it had surged over 70% from its March lows. Yet, there was no celebration.
Those who had panicked and cashed out at the bottom were frozen in a state of paralyzing regret, watching the recovery entirely from the sidelines. Those who stayed invested remained deeply cynical, dismissing the upswing as a engineered “dead-cat bounce” or a “sucker’s rally” designed to trap retail capital once more. Scarred by the previous year, fear prevented investors from deploying fresh capital, causing them to miss one of the fastest wealth-generation legs in market history.
Phase 5: The Exhausting Relief of Breaking Even
- The Data Point: November 10, 2010 | NIFTY 50: 6,275.70 (Full Recovery Milestone)
- The Emotional State: Relief and Exhaustion
- The Investor Mindset: It took two years and ten gruelling months for the NIFTY to finally claw its way back to its January 2008 peak. For the patient investors who held the line, the milestone brought no joy—only immense, exhausting relief. Their principal was finally intact.
Paradoxically, reaching this break-even milestone triggered a massive wave of redemptions. A staggering over four lakh investors are estimated to have pulled out of mutual funds in the first nine months of 2010. Weary and emotionally drained, many clients liquidated their portfolios, stating: “I just wanted my money back. I am done with equity markets forever.” They treated the recovery not as a launchpad for future gains, but as an escape hatch.
Phase 6: The Double-Dip and Psychological Fatigue
- The Data Points:
- December 14, 2011 | NIFTY 50: 4,763.25 (The Secondary Correction)
- September 5, 2013 | NIFTY 50: 5,592.95 (Years of Sideways Grinding)
- The Emotional State: Frustration, Boredom, and Apathy
- The Investor Mindset: Just as investors slowly began to re-establish trust, 2011 delivered a painful “double-dip” correction. Caught between sticky domestic inflation and the Eurozone debt crisis, the NIFTY fell back into the 4,700s.
This period was arguably the hardest for advisors to manage. The sheer duration of the stagnation created deep investor fatigue. For three long years (2011 to 2013), the market ground completely sideways. Clients became utterly apathetic, convinced that equity was an inefficient waste of time and that fixed deposits or physical gold were the only true paths to financial security.
Phase 7: Vindication and Elation
- The Data Points:
- May 30, 2014 | NIFTY 50: 7,229.95 (Post-Election Surge)
- November 28, 2014 | NIFTY 50: 8,588.25 (New Historical Peak: +39.78% above 2008 High)
- The Emotional State: Triumph, Elation, and FOMO
- The Investor Mindset: Then, the macro-narrative shifted. Following a definitive general election outcome in mid-2014, decades of built-up economic energy exploded upward. The market broke out of its three-year slumber to set massive new historic highs—skyrocketing nearly 40% above the old 2008 peak.
The clients who stayed the course—and systematically accumulated units during the flat, boring years of Phase 6—suddenly saw their portfolio values compound dramatically. Apathy transformed overnight into triumph, elation, and a renewed Fear of Missing Out (FOMO).
In the end the statistics looked like this (from Jan 2008 -Jan 2015)- Nifty 50:
- Max Drawdown: -(minus)59.86%– This is the maximum that investors sustained as a un-realized loss during the period.
- Max Recovery (Gains from Bottom): 240.24%– This is the maximum gain someone could have made by doing the impossible- timing the market!
- Returns of a SIP Investor: 13.5% pa (invested on 1st of every month)- This is the effective annual return a patient investor made, who continued to invest regularly throughout.
The Advisor’s Takeaway: Navigating the Spectrum of Human Emotion
The seven-year cycle from 2008 to 2014 proves that wealth is rarely lost because the markets fail; wealth is lost because investor behaviour breaks down. The true value of a financial planner is not found in forecasting unpredictable market tops or bottoms. The true value lies in acting as an emotional anchor—preventing you from buying into the greed of Phase 1, keeping you from capitulating at the bottom of Phase 3, and ensuring you don’t abandon the plan out of pure boredom during Phase 6. Markets will cycle, but a disciplined strategy is designed to outlast them all.